Problem 2: Fleet Migration/State
Transitions
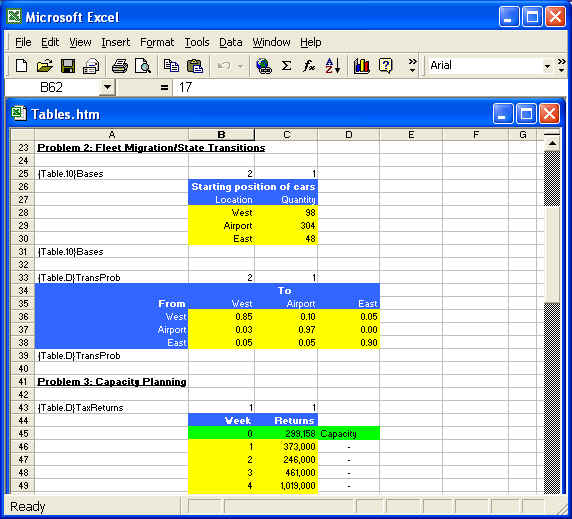
A rental car company has three rental locations (bases) in a city. Customers may drop off rentals at any one of the three locations regardless of where they pick up the vehicles. This option causes fleet migration, changing the distribution of the fleet over time among the three bases. The company wants a model to predict where the vehicles will be at the end of each work week to plan how many vehicles must be moved form where to where. Later, the model is to be expanded to develop decision rules for when cars should be moved from one base to another based on various operational factors and nonlinear cost functions.
 |
Notes
-
This problem consists of a chain of state transitions based on a transition probability matrix as shown in the table above.
-
The desired solution for this particular problem can be coded very easily in any higher order language with good intrinsic procedures for handling arrays. However, the purpose of this example is to show how to build a descriptive model of a situation to facilitate what-if analysis, and to provide insight into how the model might be expanded to consider more complex issues related to the problem, such as costs of relocating vehicles, how often vehicles should be relocated, pricing, incentives, etc.
|
Assumptions |
-
Probability of vehicles transitioning from a location to itself also accounts for vehicles remaining at that location at the end of any given day, because they were not rented.
-
Transition probabilities also account for vehicles rented for any number of days; they are reliable averages observed over time.
|
Formulation |
Formulation of this problem is more easily understood through its ORMSware network diagram and supplemental data files. Click the links below as desired to open these files in separate windows for reference while reading this document.
VSD
file: Image of Visio network file describing the model
Results: Preview of results of this
model.
Number of vehicles at any base B after the nth transition can be found by multiplying the number of vehicles at each base after the (n-1)th transition by the probability that they will transition to B, and adding up those results. For example, number of vehicles at the West location after the first transition will be {98*0.85 = 83.30} + {304*0.03 = 9.12} + {48*0.05 = 2.40} = 94.82.
Thus, distribution of vehicles after the nth transition is the distribution vector of vehicles after the (n-1)th transition multiplied by the transition probability matrix. This core part of this model (see transition part in black & white section below) can be coded in Fortran 95 in a matter of minutes as shown below. Obviously, if this is all the company wants to find out every week, slight modification of the code below with a bit more flexibility will be sufficient to serve that purpose. However, if the company wishes to expand the model to incorporate other operational and service issues and strategic pricing, NMOD is likely to be a more desirable and faster model development tool.
| PROGRAM
StateTransitions USE Kinds IMPLICIT NONE REAL(KIND=dbl),DIMENSION(3)::
dblPreviouslyAt = (/98.,304.,48./) !Rentals at start |
DO regIndx=1,regMaxTrans dblCurrentlyAt = MATMUL(dblPreviouslyAt,dblTransProb) dblPreviouslyAt = dblCurrentlyAt ENDDO |
|
!dblCurrentlyAt vector can then be written to a results file to see the... MODULE Kinds
|
|
Execution |
This model has some similarities to Problem 1 in that it has a divergent node in a cycle (n[7]-{a[8],a[5],a[6]}-n[3]-{a[9],[10],[11]}-n[7]) spawning multiple calculation threads. However, the difference here is that the multiple entities created during a cycle are merged back into one entity by the last node (n[7]) in the cycle.
Multiple arcs between same pairs of nodes (see arcs between n[7] and n[3]) are used to capture vehicles available at each base on a given day, and to calculate daily migration. For each calculation thread arriving at n[3] from n[7], three threads go from n[3] back to n[7], creating 9 threads in each transition cycle.
Added advantage of modeling this problem in this manner is the ease with which complex cost functions can be incorporated into the model at a later stage for (say) moving vehicles from one location to another.
Model execution starts at the Start node of the network, viz. n[2]Initializations located at the top left of the page.
|
Contents of key nodes and arcs |
n[7]Cars rented: This node sets things up for the next transition cycle. It sets the vector dblPreviouslyAt, which tracks the number of vehicles at every base at the end of previous cycle, equal to dblCurrentlyAt. dblCurrentlyAt is a vector used to accumulate transitions into each base from other bases during a day (cycle). Since dblCurrentlyAt is an accumulation vector for each cycle, n[7]Cars rented resets all of dblCurrentlyAt's elements to zero before launching a new cycle.
{a[8],a[5],a[6]}Cars rented--->|Cars returned: An entity (calculation thread) arriving at n[7]Cars rented multiplies to three entities as it branches out along a[8], a[5] and a[6]. a[8] stamps entities traveling on it as vehicles located at the West base as a new cycle begins; a[6] stamps entities as vehicles located at the Airport base, and so on.
n[3]Cars returned: The only function this node serves is to be a logical junction for allowing vehicles from any base to be returned to the same base or any other base. Thus, three entities entering n[3]Cars returned multiply to 9 entities, accounting for returns of vehicles from each of the three bases to any of the three bases.
| StateTransition.[9]Cars returned-->>|Cars rented | |
 |
{a[9],a[10],a[11]},
viz. arcs between n[3]Cars returned
and n[7]Cars rented,
stamp entities traveling along them as vehicles being returned to the bases they
specifically refer to (new base). For example, in the dialog box for a[9]
(see image at left), notice that the transformation property logic
sets the entity's new base to be West. It then
calls an user-defined procedure called RentalReturns to track how many vehicles
are being returned to the West location by telling RentalReturns
which base the vehicles are coming from and where they are going.
Notice that a[9], as well as its parallel arcs [10] and [11], have Duration properties. The 1 entered for Duration in the dialog box causes the calculation thread traveling along these arcs to be suspended for one day of conceptual time. Time dimension is not necessary in the current state of this model, but it will be very helpful if the model's scope is expanded to accommodate various business and operational issues. |
Notice also that [9], [10] and [11] are AND arcs (see Type property in the dialog box image above and the corresponding double-headed arrows in the Visio diagram).
Convergence requirement on an AND arc is 1 by default. If the convergence node at which an AND arc terminates has k AND arcs terminating at it in total, k calculation flows must arrive at that node to cause it to fire. In this case there are three AND arcs terminating at n[7]. So, the default convergence requirement will be 3. However, we needed to ensure that each of these three arcs received a flow from every base (i.e. 3 flows each, carrying vehicle movement from every base to every base) during a transition cycle. We could accomplish this in two ways as explained below (we have used both in the model for illustration purposes):
- Define the overriding requirement in the flow vectors of
these arcs. Since the convergence requirement along each of these arcs will be k
if the total number of bases is k, we can enter this expression as the 5th
element of the flow vector (see, for example, image of [9]'s dialog box
above). Since we are using regTotBases to represent total number of bases
(k),
we have entered regTotBases as the expression for modifying the default
convergence requirement on this arc. NMOD executes this modification before
executing any other user-defined logic in the model.
- The above method only changes the convergence requirement along one AND arc at a time, causing the difference from default along each arc to be added to the total convergence requirement at terminating node n[7]. We can modify the total convergence requirement at n[7] in one swoop by calling the procedure ChangeConvergenceReqirement.
|
Approach |
Click here to view a file containing the results calculated by this model to determine the location of vehicles at the end of 5 transitions (Monday-Friday).
This problem can be restructured slightly, raising the level of abstraction by replacing the three arcs leading into and out of n[3]Cars returned with single arcs. The purpose of doing that would be to facilitate scaling the model easily to handle cities with many more rental locations.
Instead of doing the above, it is possible to use this model as is to
incorporate more rental locations. But, adding more arcs in and out of n[3]
will make those two parts of the diagram cluttered and opaque. This does not
affect the functionality of the model. It only affects clarity of the network
representation with the potential for introducing human error from the confusion
of dealing with some objects obscuring others.